Historical Electricity Rates Ontario
Historical electricity rates Ontario for residential and small businesses customers under time-of-use (TOU) rates.
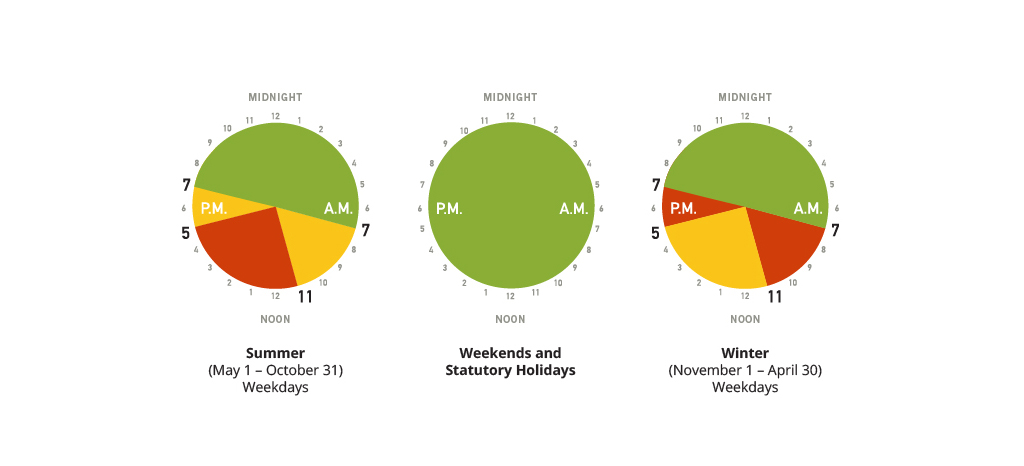
Most residential and small business customers are billed their monthly electricity usage using time-of-use rates. Time-of-use rates mean that the price of electricity depends on the time of day that it is being used. There are three different price points for electricity under TOU rates. Off-peak time is when electricity rates are the cheapest, then mid-peak time, and the most expensive rates are during on-peak time.
The chart below shows the TOU historical electricity rates Ontario from 2006-2018:
| Effective date | Off-peak price | Mid-peak price | On-peak price |
| (¢ per kWh) | (¢ per kWh) | (¢ per kWh) | |
| 01-May-18 | 6.5 | 9.4 | 13.2 |
| 01-Jul-17 | 6.5 | 9.5 | 13.2 |
| 01-May-17 | 7.7 | 11.3 | 15.7 |
| 01-Nov-16 | 8.7 | 13.2 | 18 |
| 01-May-16 | 8.7 | 13.2 | 18 |
| 01-Nov-15 | 8.3 | 12.8 | 17.5 |
| 01-May-15 | 8 | 12.2 | 16.1 |
| 01-Nov-14 | 7.7 | 11.4 | 14 |
| 01-May-14 | 7.5 | 11.2 | 13.5 |
| 01-Nov-13 | 7.2 | 10.9 | 12.9 |
| 01-May-13 | 6.7 | 10.4 | 12.4 |
| 01-Nov-12 | 6.3 | 9.9 | 11.8 |
| 01-May-12 | 6.5 | 10 | 11.7 |
| 01-Nov-11 | 6.2 | 9.2 | 10.8 |
| 01-May-11 | 5.9 | 8.9 | 10.7 |
| 01-Nov-10 | 5.1 | 8.1 | 9.9 |
| 01-May-10 | 5.3 | 8 | 9.9 |
| 01-Nov-09 | 4.4 | 8 | 9.3 |
| 01-May-09 | 4.2 | 7.6 | 9.1 |
| 01-Nov-08 | 4 | 7.2 | 8.8 |
| 01-May-08 | 2.7 | 7.3 | 9.3 |
| 01-Nov-07 | 3 | 7 | 8.7 |
| 01-May-07 | 3.2 | 7.2 | 9.2 |
| 01-Nov-06 | 3.4 | 7.1 | 9.7 |
| 01-May-06 | 3.5 | 7.5 | 10.5 |
Visit Ontario Energy Board website for more information
Fixed Price Energy
Canada Locations
Albertasoon
British Columbiasoon
Manitobasoon
Ontario
Quebecsoon
Saskatchewansoon


 (Rated 4.89 out of 5)